All Your Employee Advocacy Reporting in One Platform
Every advocacy metric in one place, from reach to ROI. See what's working and give leadership the numbers they trust.


Reporting Dashboard Overview
Understand the Full Impact of Your Advocacy Program
Get a complete overview of how your employee advocacy program performs. Ambassify provides employee advocacy analytics that help you understand engagement, reach, and ambassador activity in one clear dashboard:
- Monitor engagement and reach across campaigns
- Track clicks and website traffic generated by employees
- Identify your most active ambassadors
- Follow program growth and participation over time.
Flexible Data Filtering
Zoom In On the Insights That Matter
Break down performance by campaign, team, ambassador group, or time period. With flexible filters, you can quickly understand which content drives engagement and which teams generate the most impact. Use filters to:
- Compare campaign performance side by side
- Analyze results by team, department, or ambassador group
- Review performance within custom date ranges
- Identify top-performing content and employee advocates.
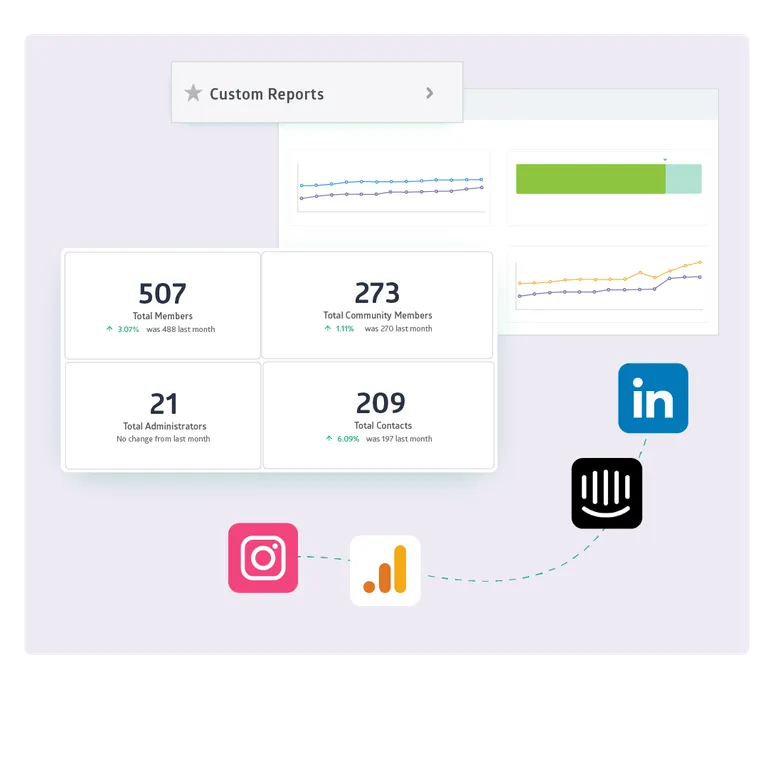
Custom Reporting Dashboards
Build Reports Tailored to Your Program
Custom dashboards can be enabled and integrated on Ambassify to collect and show the most valuable metrics to you at a glance.
Ambassify also allows you to export and sync custom report data with your existing analytics or reporting tools.
Per-Channel Performance Insights
See What Works On Every Social Platform
Ambassify's social media reporting dashboard tracks results across platforms like LinkedIn, Facebook, and X. Through direct API connections with these platforms, Ambassify automatically collects accurate performance data and keeps your reports up to date. Monitor key metrics such as:
- Shares
- Clicks
- Impressions
- Reach
- Engagement


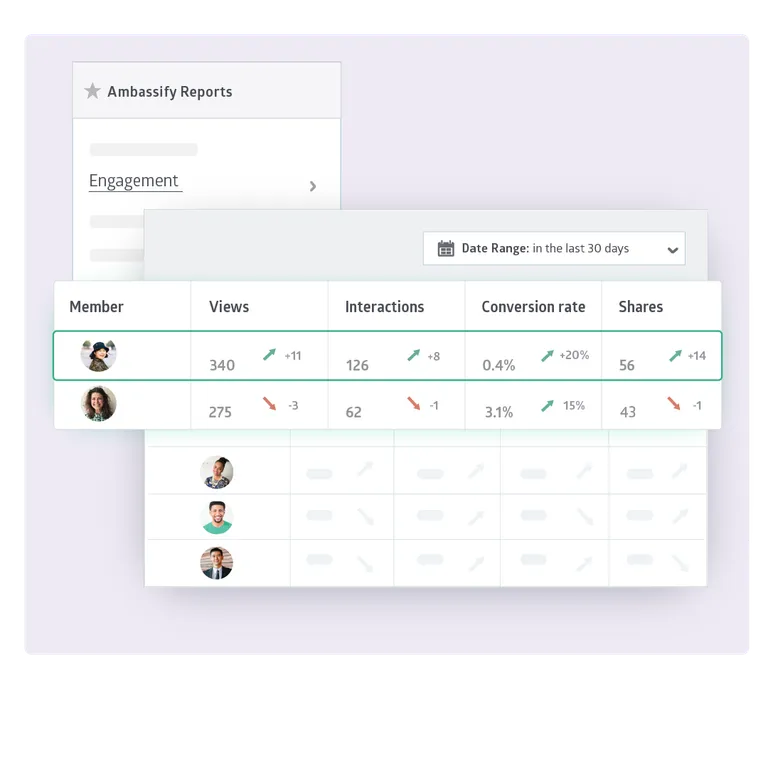
Track Advocate Performance
Ambassador Activity, Skills and Leaderboards
See which ambassadors drive the most traffic, clicks and engagement. Rank advocates by activity, reach or engagement to find your thought leaders and rising voices.
Inside the same platform, the Ambassify Skills admin dashboard tracks which employees have completed which paths (Boost, Share, Edit Share Message, Personal Post) and shows where people get stuck, so you know who is gaining confidence and who needs more support.
Global Community
Multilingual Programs, One View
Run advocacy across Belgium, France, Germany or other countries from one community, and still see how each region performs without spinning up a separate report. Filter by language, region or segment in two clicks.

Active members tracking
Total members, total advocates and interacting members per team, region or language. The clearest signal of program health.
Period-over-period trends
Compare any rolling or custom date range against the previous period. Green and red arrows show what is improving and what is not, at a glance.
Member & group level reporting
Drill into individual ambassador activity or roll up by group, department or business unit. Same data, the cut the audience needs.
Quarterly Performance Report
Enterprise-tier structured overview across Members, Campaigns and Sharing, with quarter-over-quarter comparisons on every metric, ready to share with the leadership team.
Built-in metric definitions
Every metric on every screen comes with an inline definition, so ops, finance and executive teams interpret the same number the same way.
Attachment and link analytics
Track which attachment formats (image, video, link, native video) and embedded message links drive the most clicks and engagement. Optimise what works, drop what does not.

"Ambassify helps us regularly dig deeper and get valuable, segmented usage insights. The in-built, filter-based emailer makes it extremely easy to reach target groups."
— Lennart Crossley, Swiss Life Germany
Part of a Structured Framework
Measure is the bridge between Activate and Prove. It shows what your program is doing today, then feeds the data into how you prove business impact to leadership. Explore the complete framework:
Know Where To Start

Build Confidence
Build alignment and confidence with practical social media training that helps employees feel ready to participate.

Drive Participation
Turn readiness into action with guided participation, low-friction sharing, and simple next steps.

Understand Performance
Track participation, reach, and engagement so you can understand what is working and improve over time.

Show Business Impact
Connect employee advocacy activity to business value and show impact with clear reporting.
