Ambassify Custom Reporting Explained

Here at Ambassify, we have always been aware of the importance of data.
That’s why we’ve put a lot of effort and focus into collecting all our available data from the start to gain interesting insights about our customers and product and make data-driven decisions.
And let me tell you, there is quite some data in a SaaS company.
Being a company that loves open-source solutions, we experimented with different ones and went through several stages before finally getting where we are today.
- Implementing AWS to run our software and store our data
- Establishing Datahub as our data catalog to professionalize our data governance and improve data quality
- Deploying Metabase as our open-source Business Intelligence tool to create advanced dashboards
- …
While this has already helped us a lot internally, we consider this to be merely the start. Being the customer-oriented company that we are, it’s really all about how we can use this information to help our customers benefit from this!
Is your business ready for employee advocacy?
So here’s why we launched the Custom Dashboards in Ambassify!
Now, we know we already have an awesome reporting feature available in the platform — that’s basically where you can see how your members and segments are doing in terms of engagement, sharing, etc.
And yet, we figured that sometimes you might just want that little bit extra. Without further ado, let’s make some real examples to get you started.
Visual trends in engagement
By activating and following trends, you can quickly identify peaks and drops in engagement within the community.
Let’s say you have a monthly trend view on Activation Rate — active members vs. total members — and you see this is going down in time.
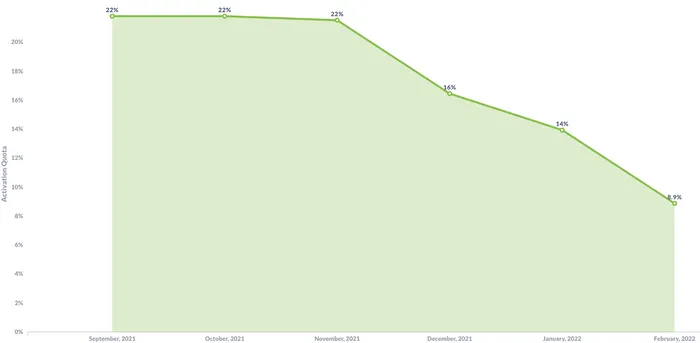
Not only will you be able to identify that trend, but you will also have the tools to do something about it.
You might wonder who has lost touch with the community and want to re-motivate them to become active Ambassadors. In a custom dashboard, we can quickly create an export table where you can export an Excel list of inactive members. This step will allow you to, names at hand, contact your employee Ambassadors and give them new motivation.
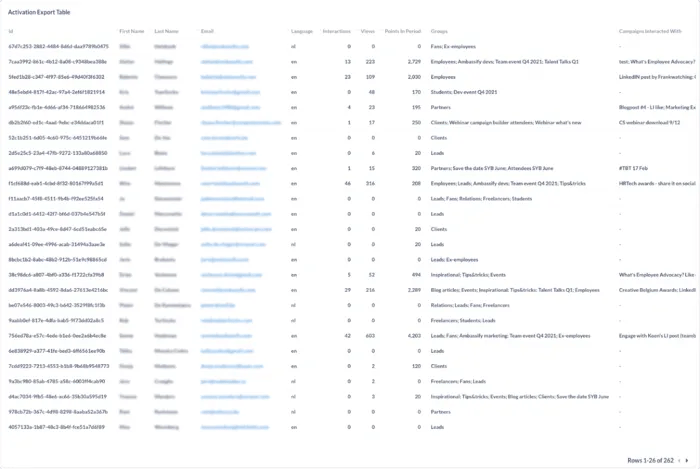
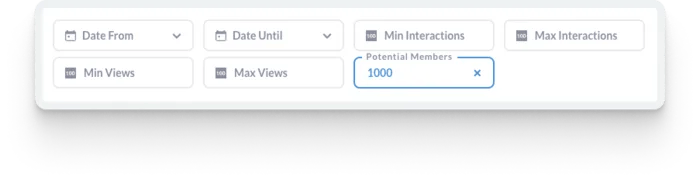
You can easily filter this table to select the period, the minimum and maximum interventions, etc.
Vice versa, using these filters, you could also see who your top Ambassadors are in terms of interactions.
An overall community view
Another way to configure your customer dashboard is to go for an overall program view to always be able to see what goes down in your community at a glance.
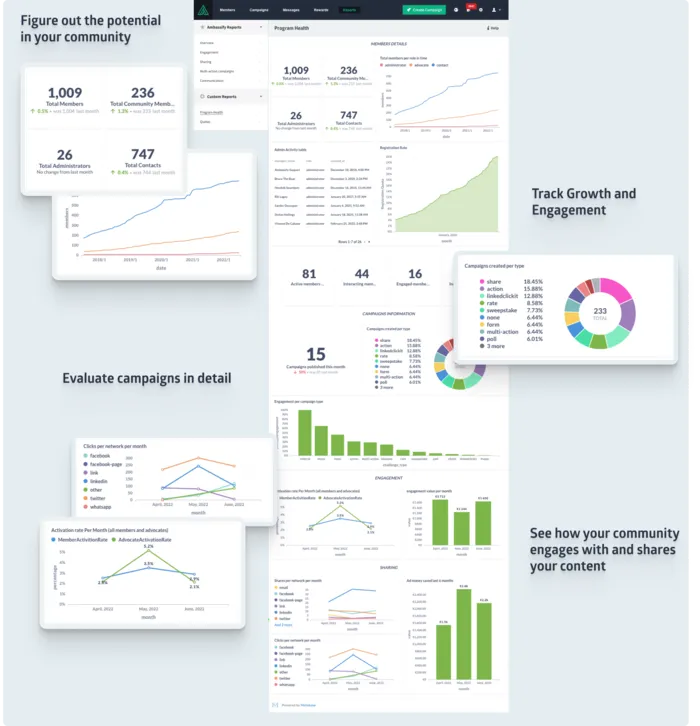
What content works best for my community?
Another available option is to set up a more in-depth view of the community to identify the kind of content that works best for your platform members.
Custom dashboards will give you the tools to answer a series of content-related questions, such as:
- What type of content triggers the most engagement among my Ambassadors?
- With what campaigns are my Ambassadors interacting the most, and why?
- When does our content receive the most online engagement?
How does it work?
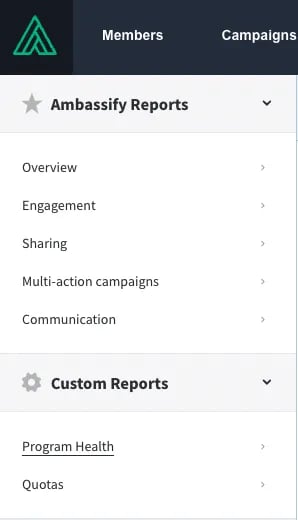
No matter what kind of dashboard you want to choose for your platform, it can easily be embedded in your community. It will appear as a new item in your sidebar, displaying all custom reports you want.
And that’s it, easy as that! You’ll have your custom insights available on your platform.
Questions? Doubts? More insights? Don’t hesitate to reach out to us!